Destination Guides
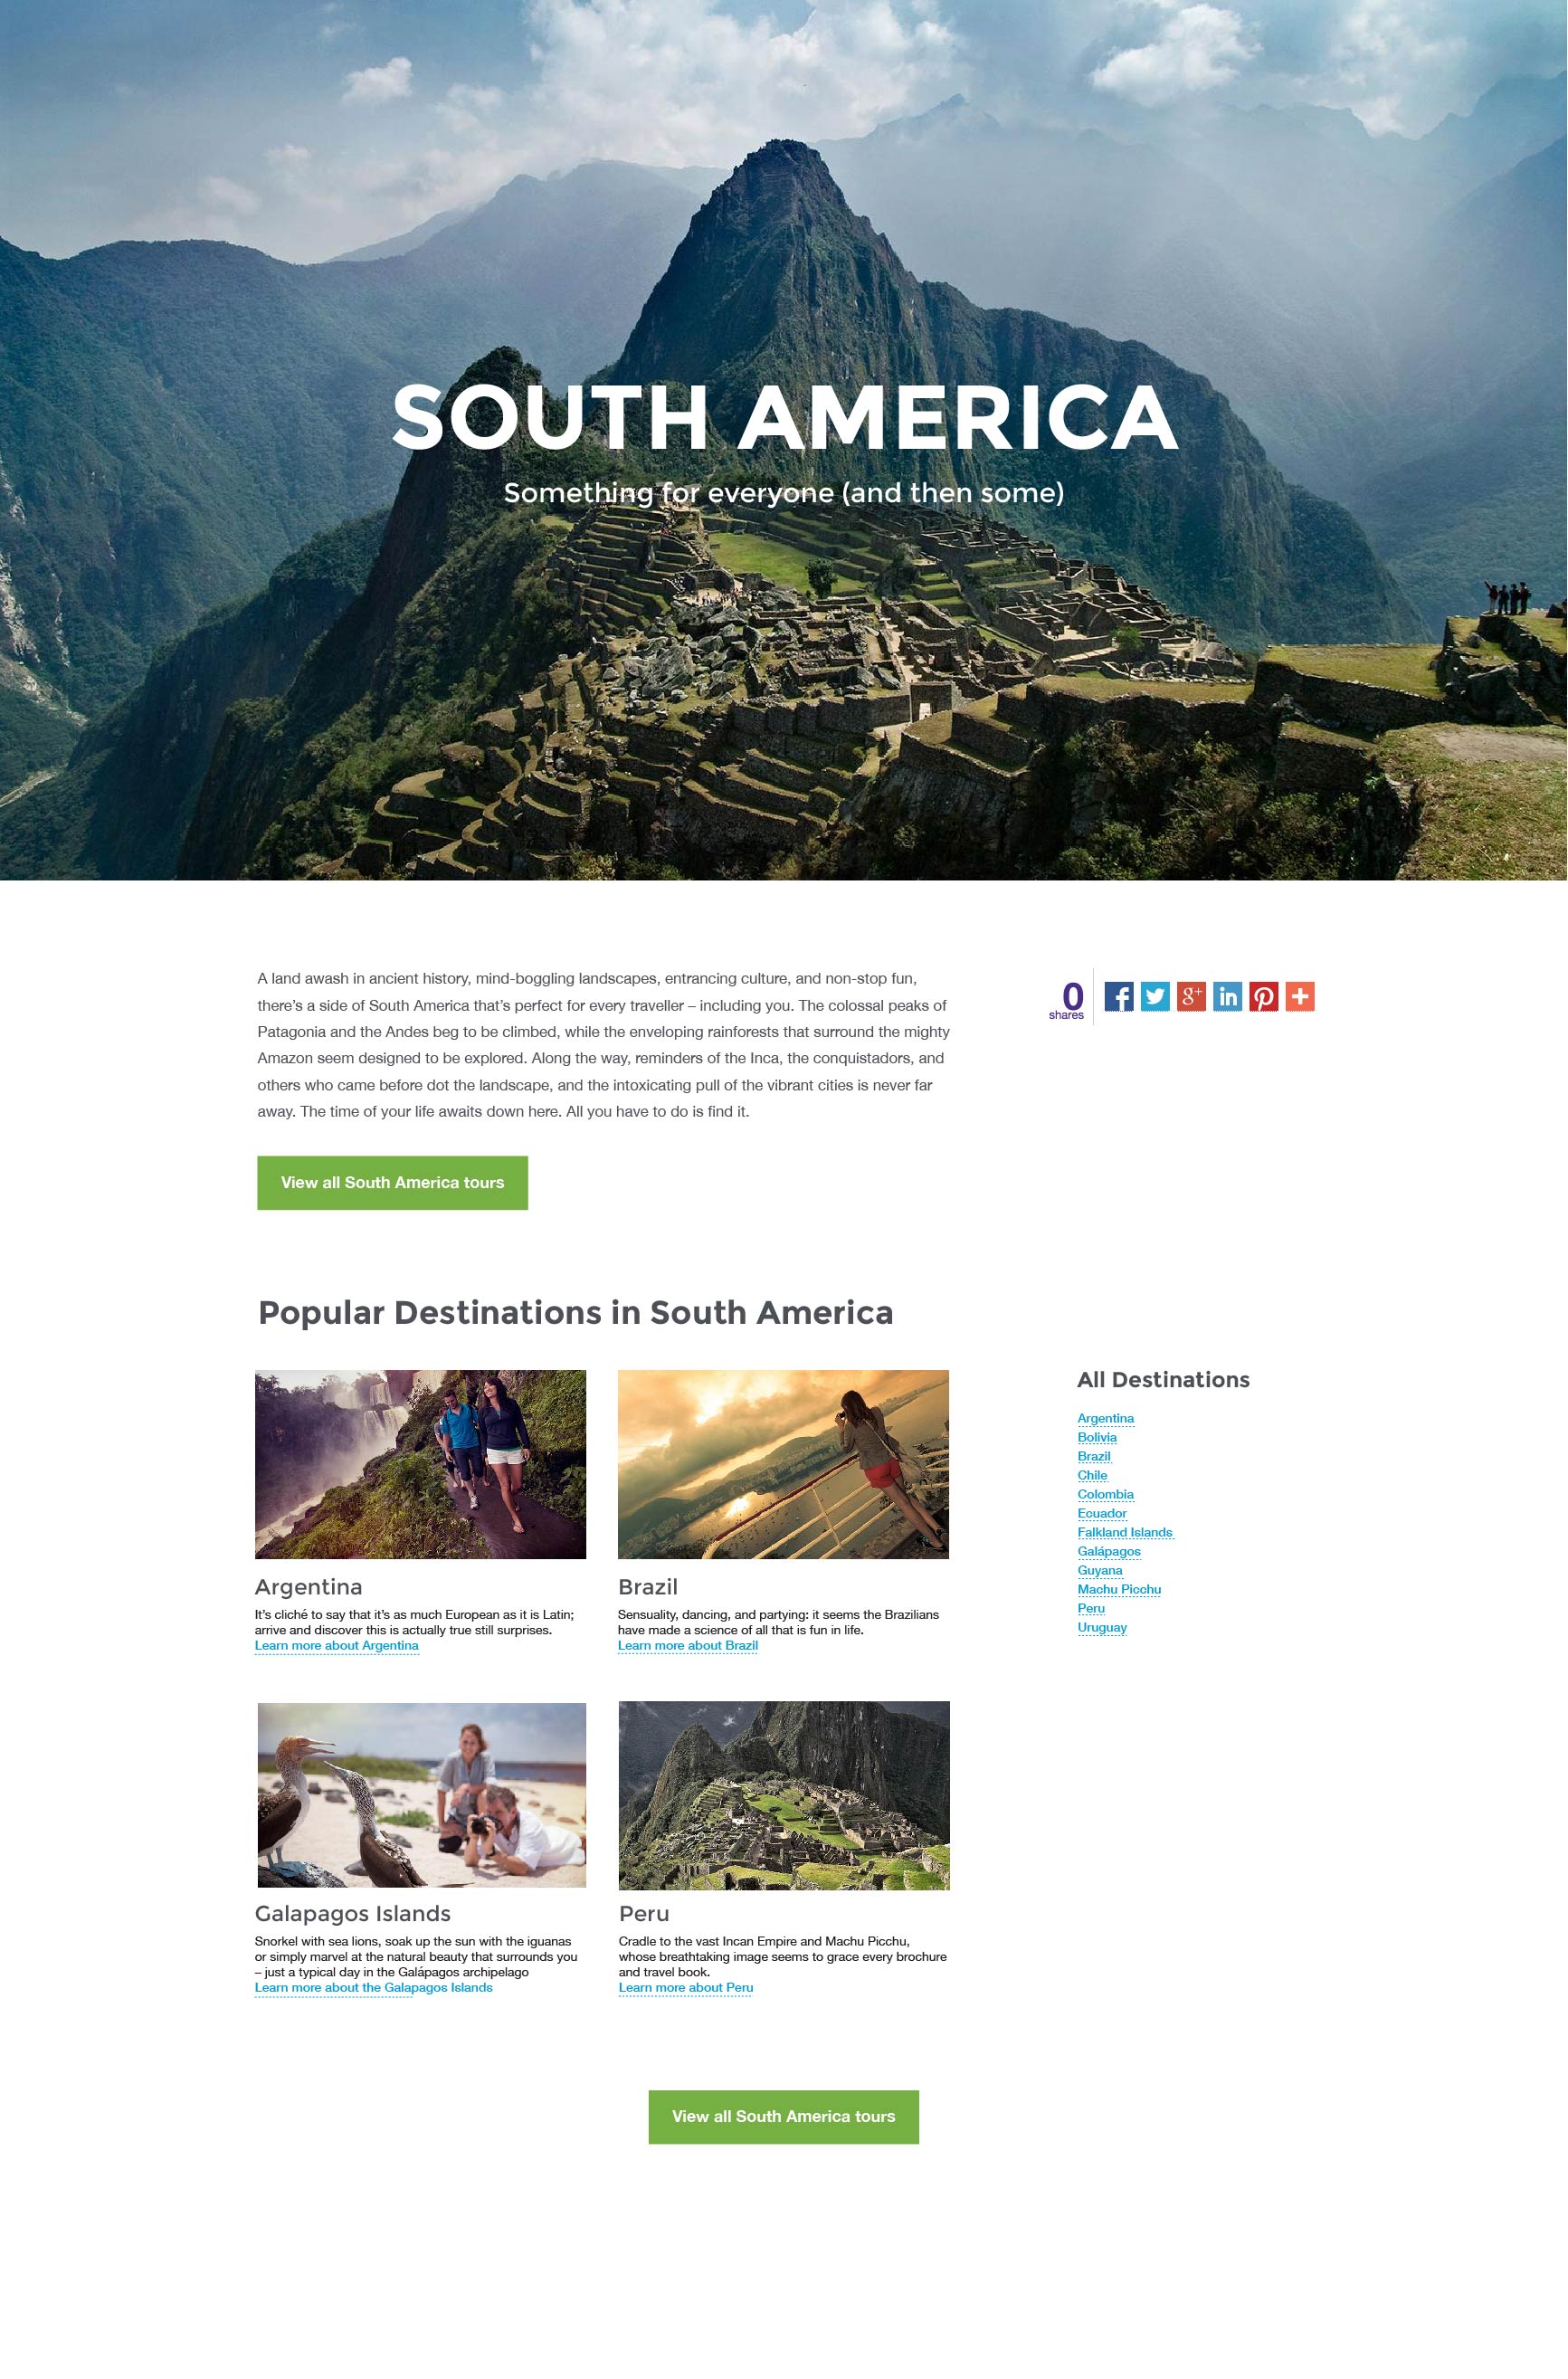
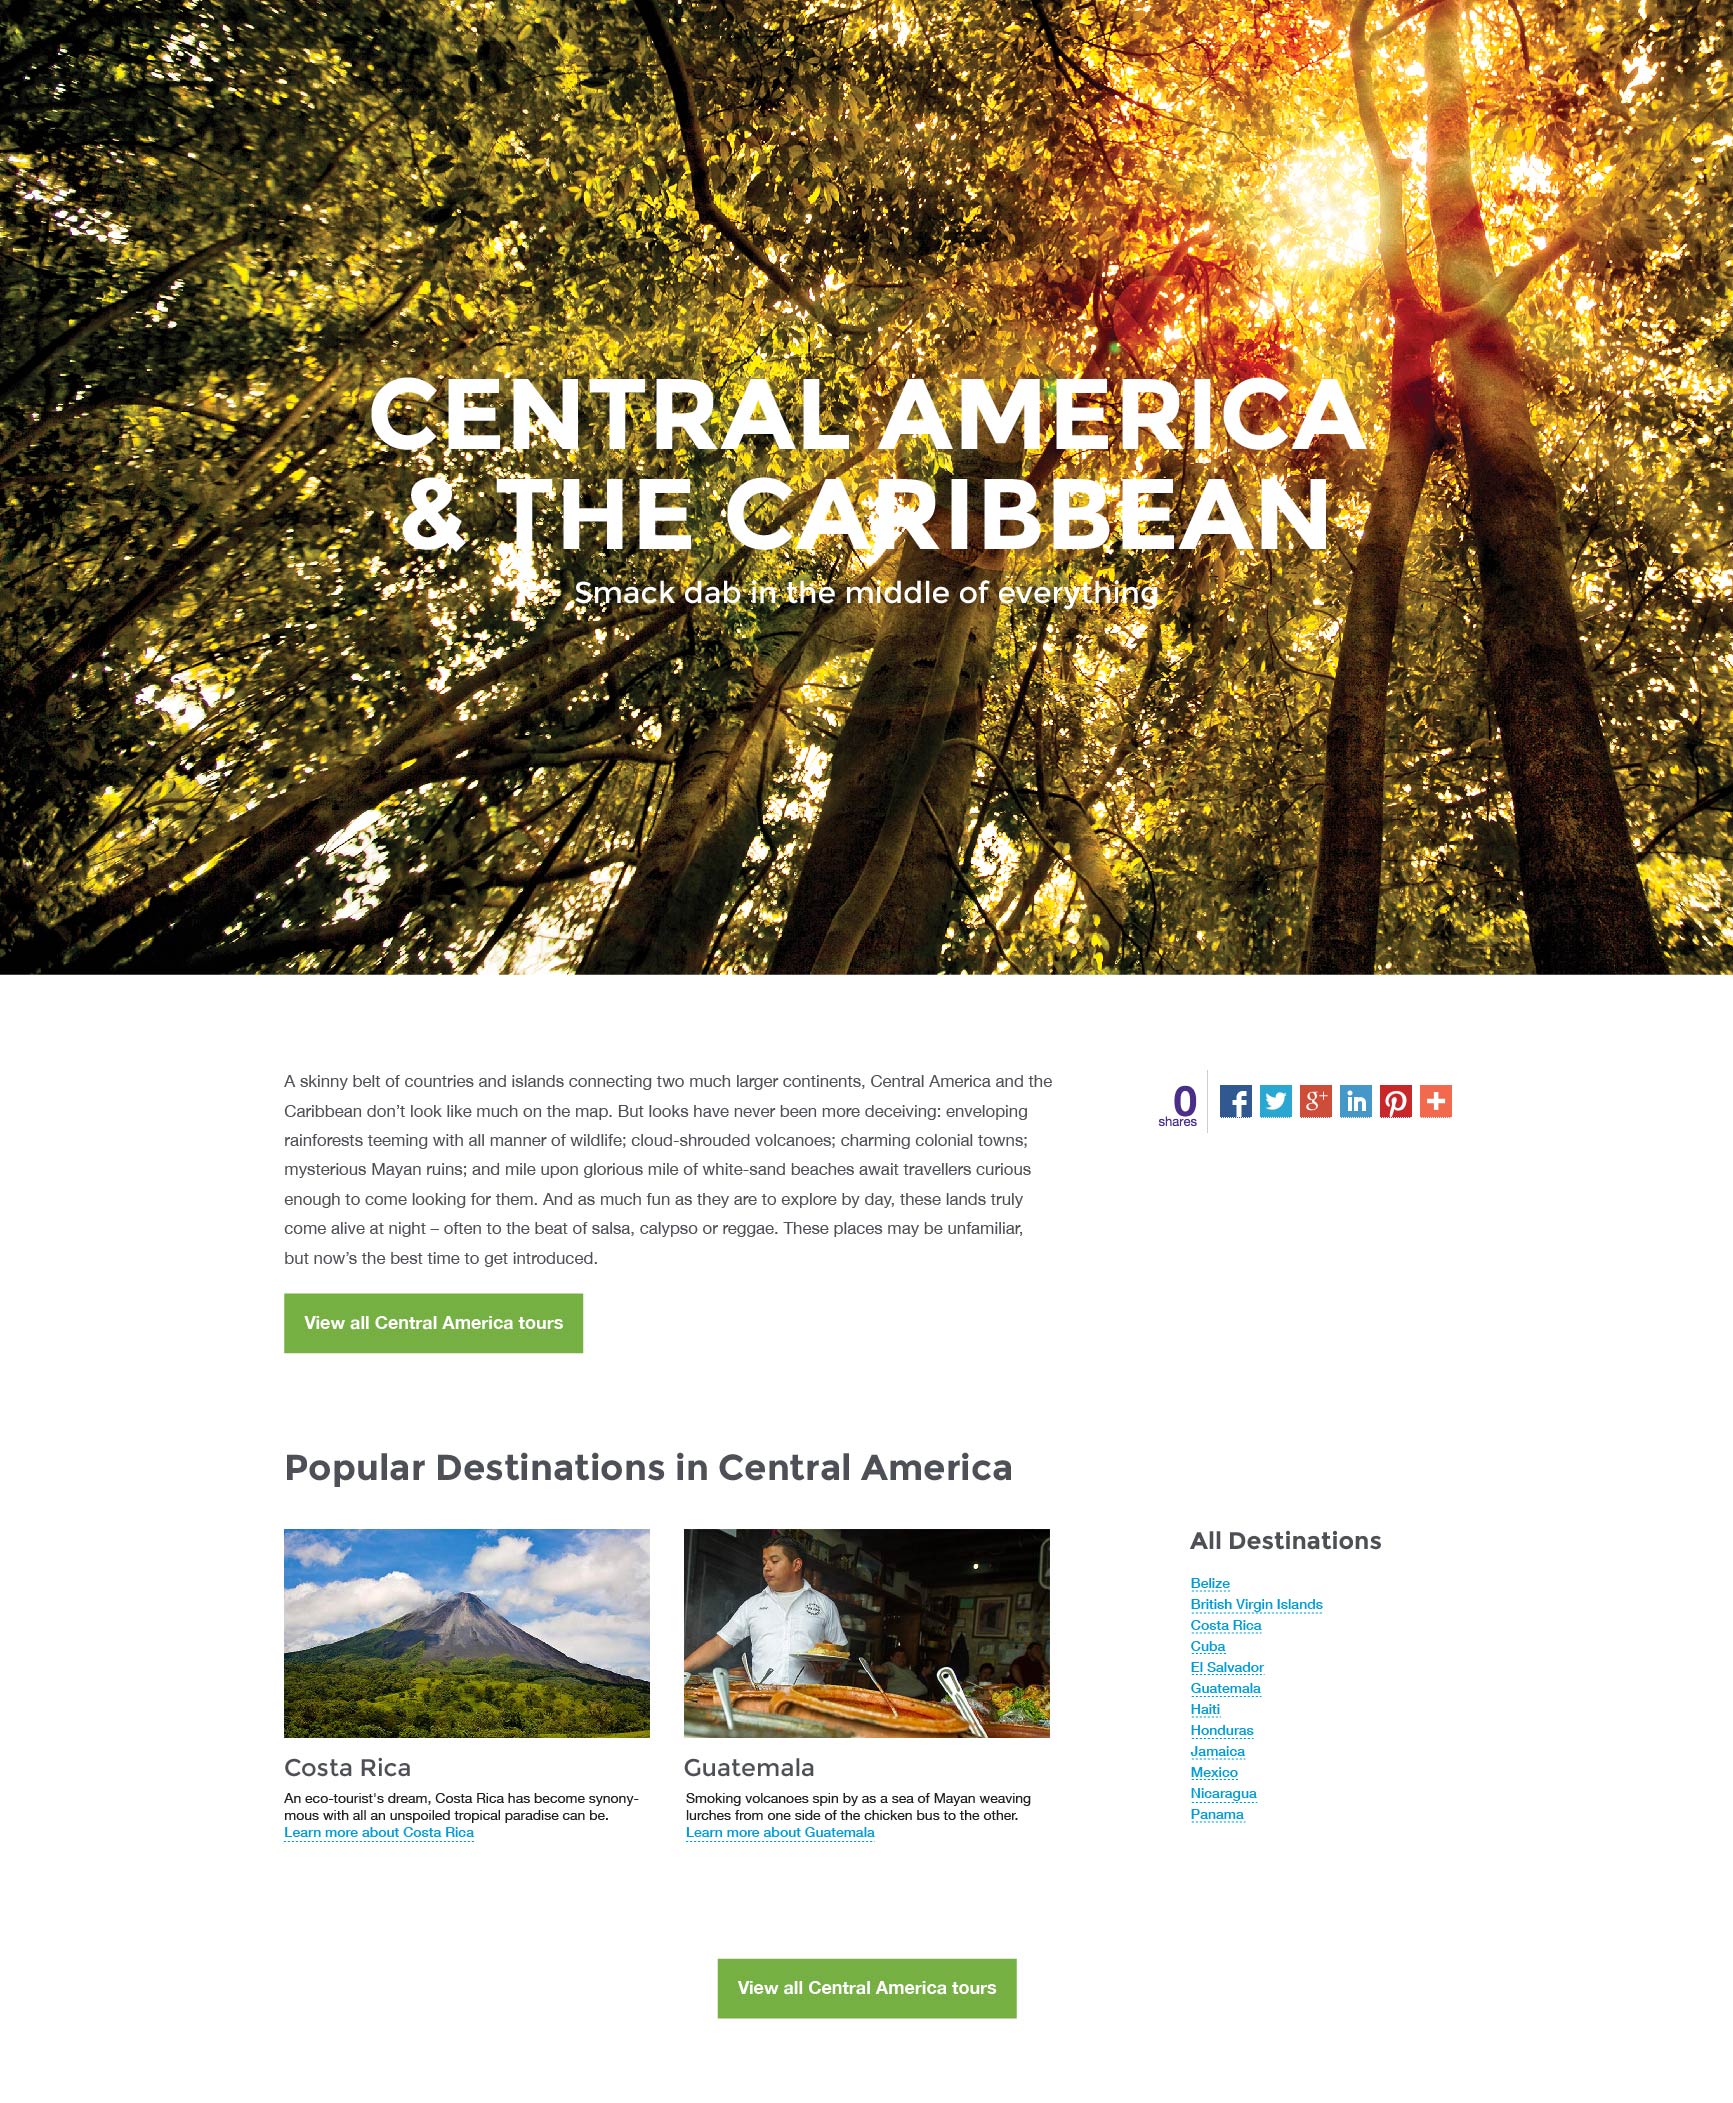
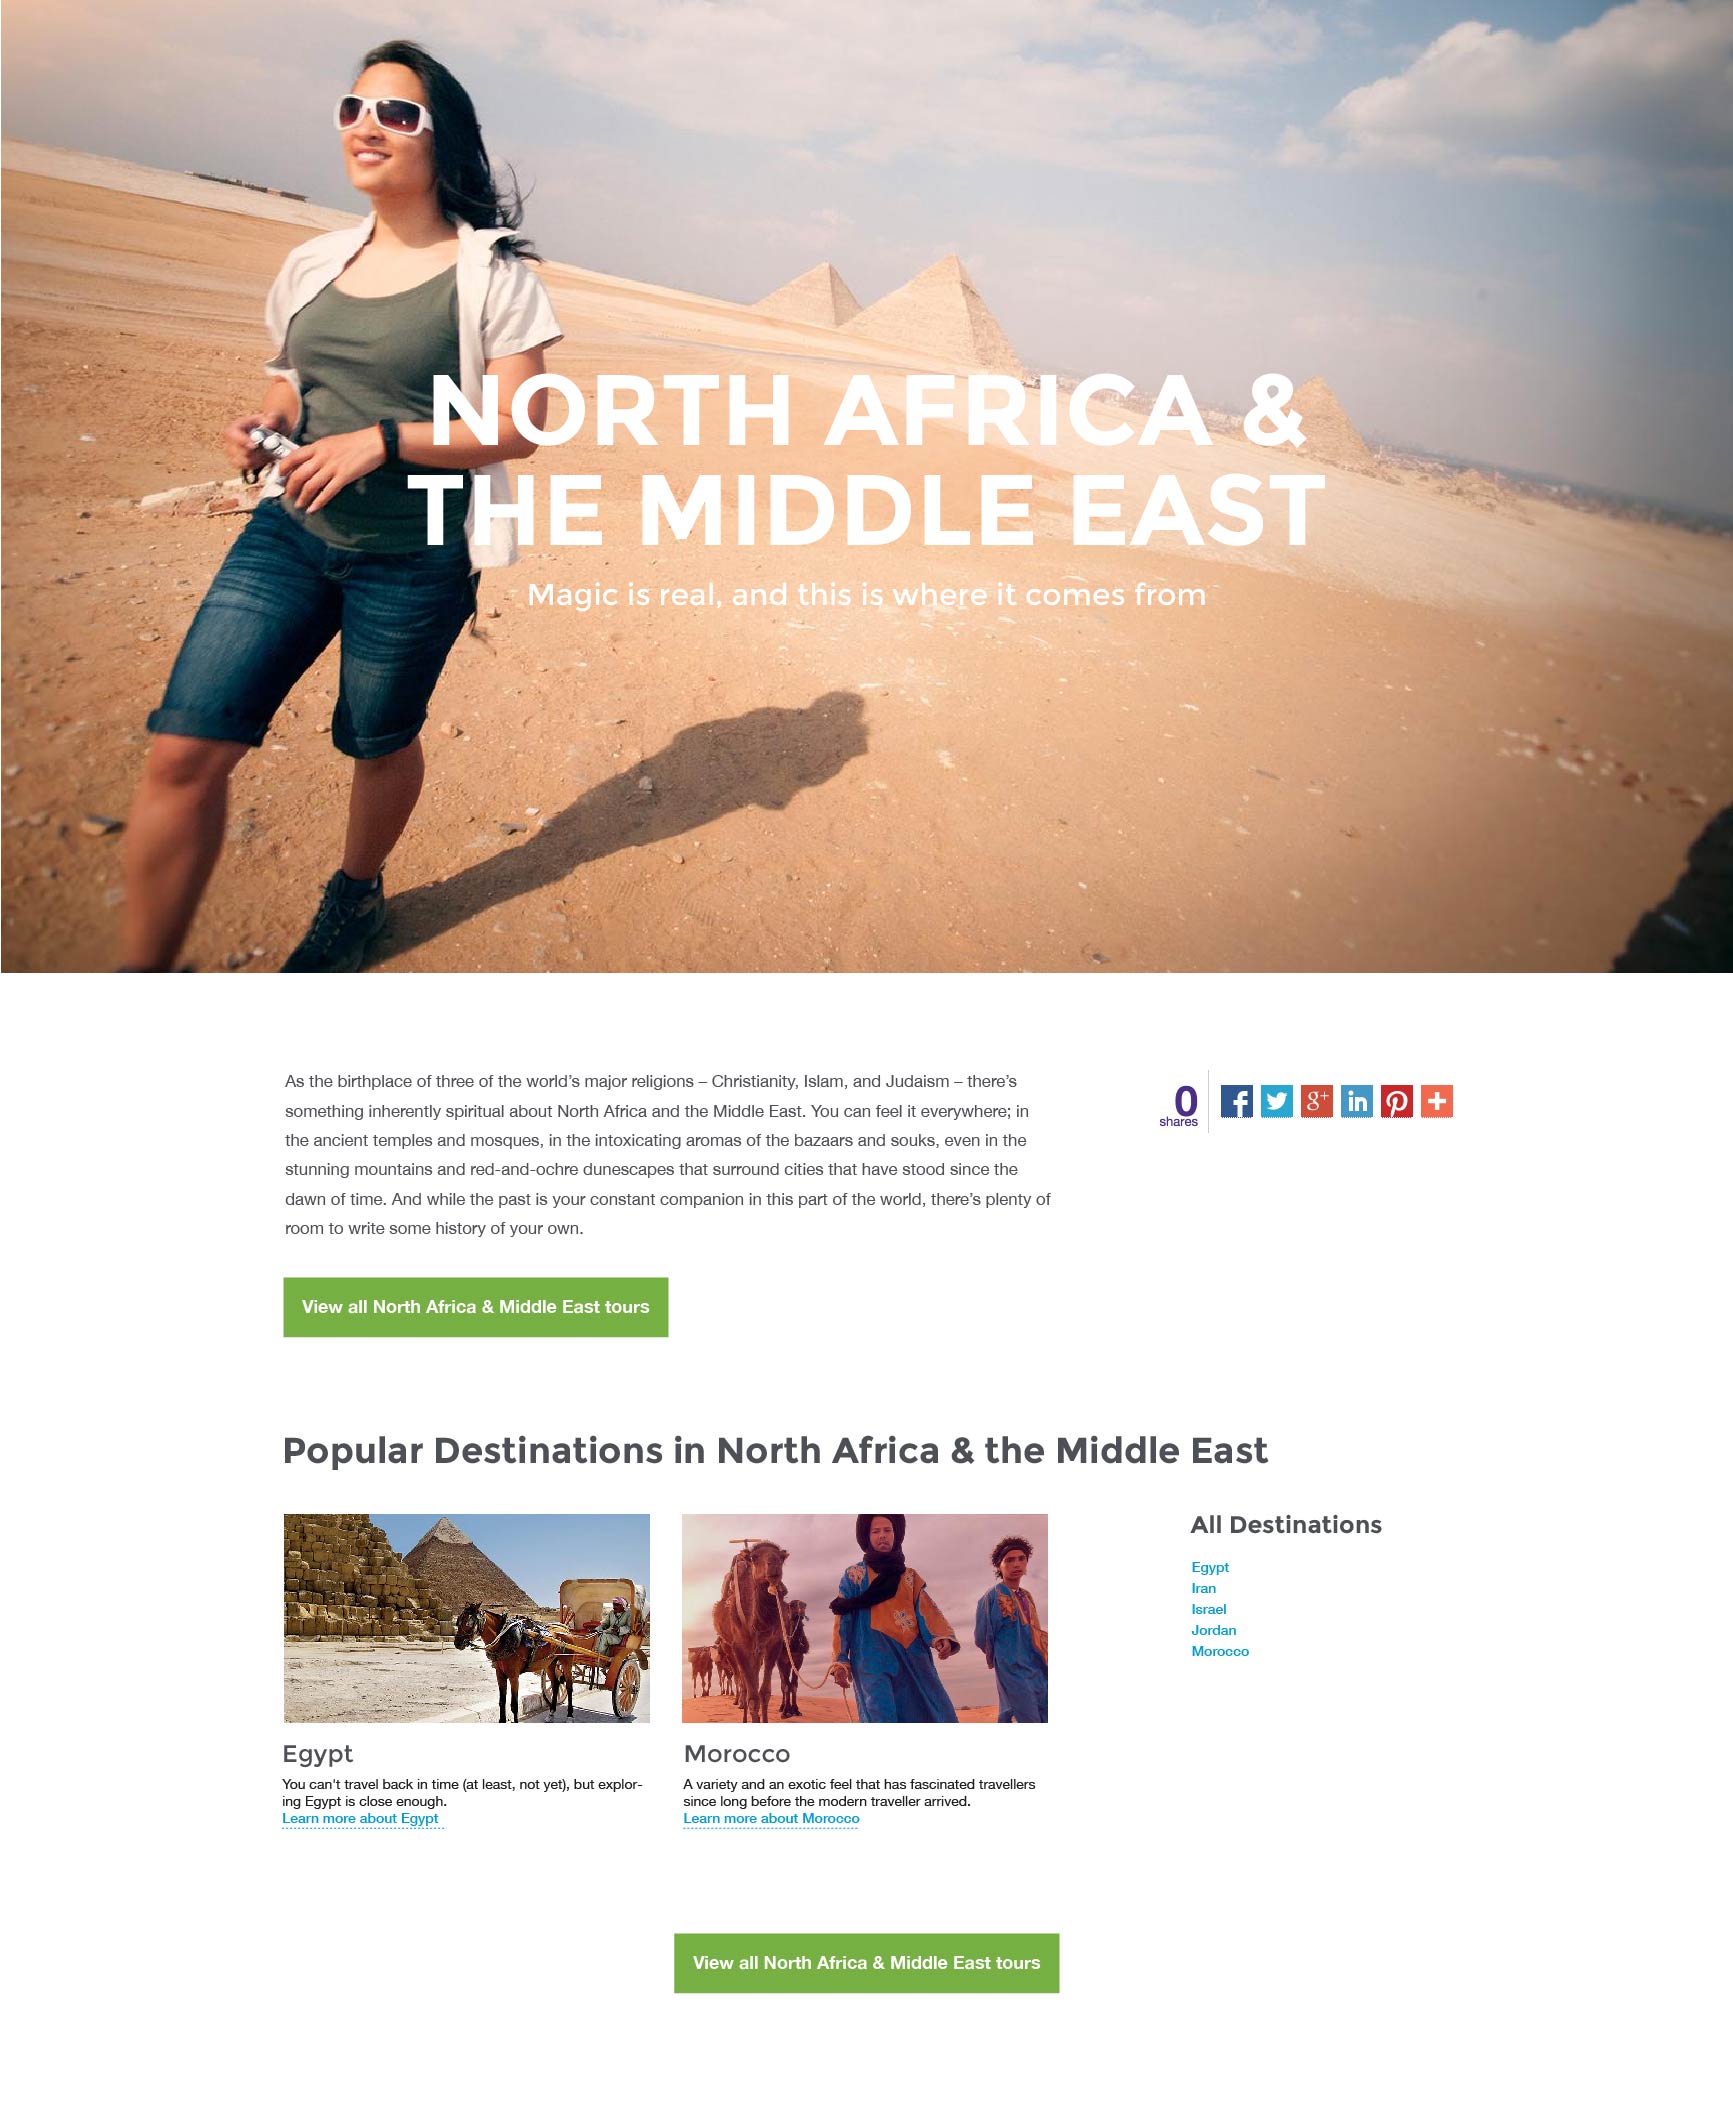
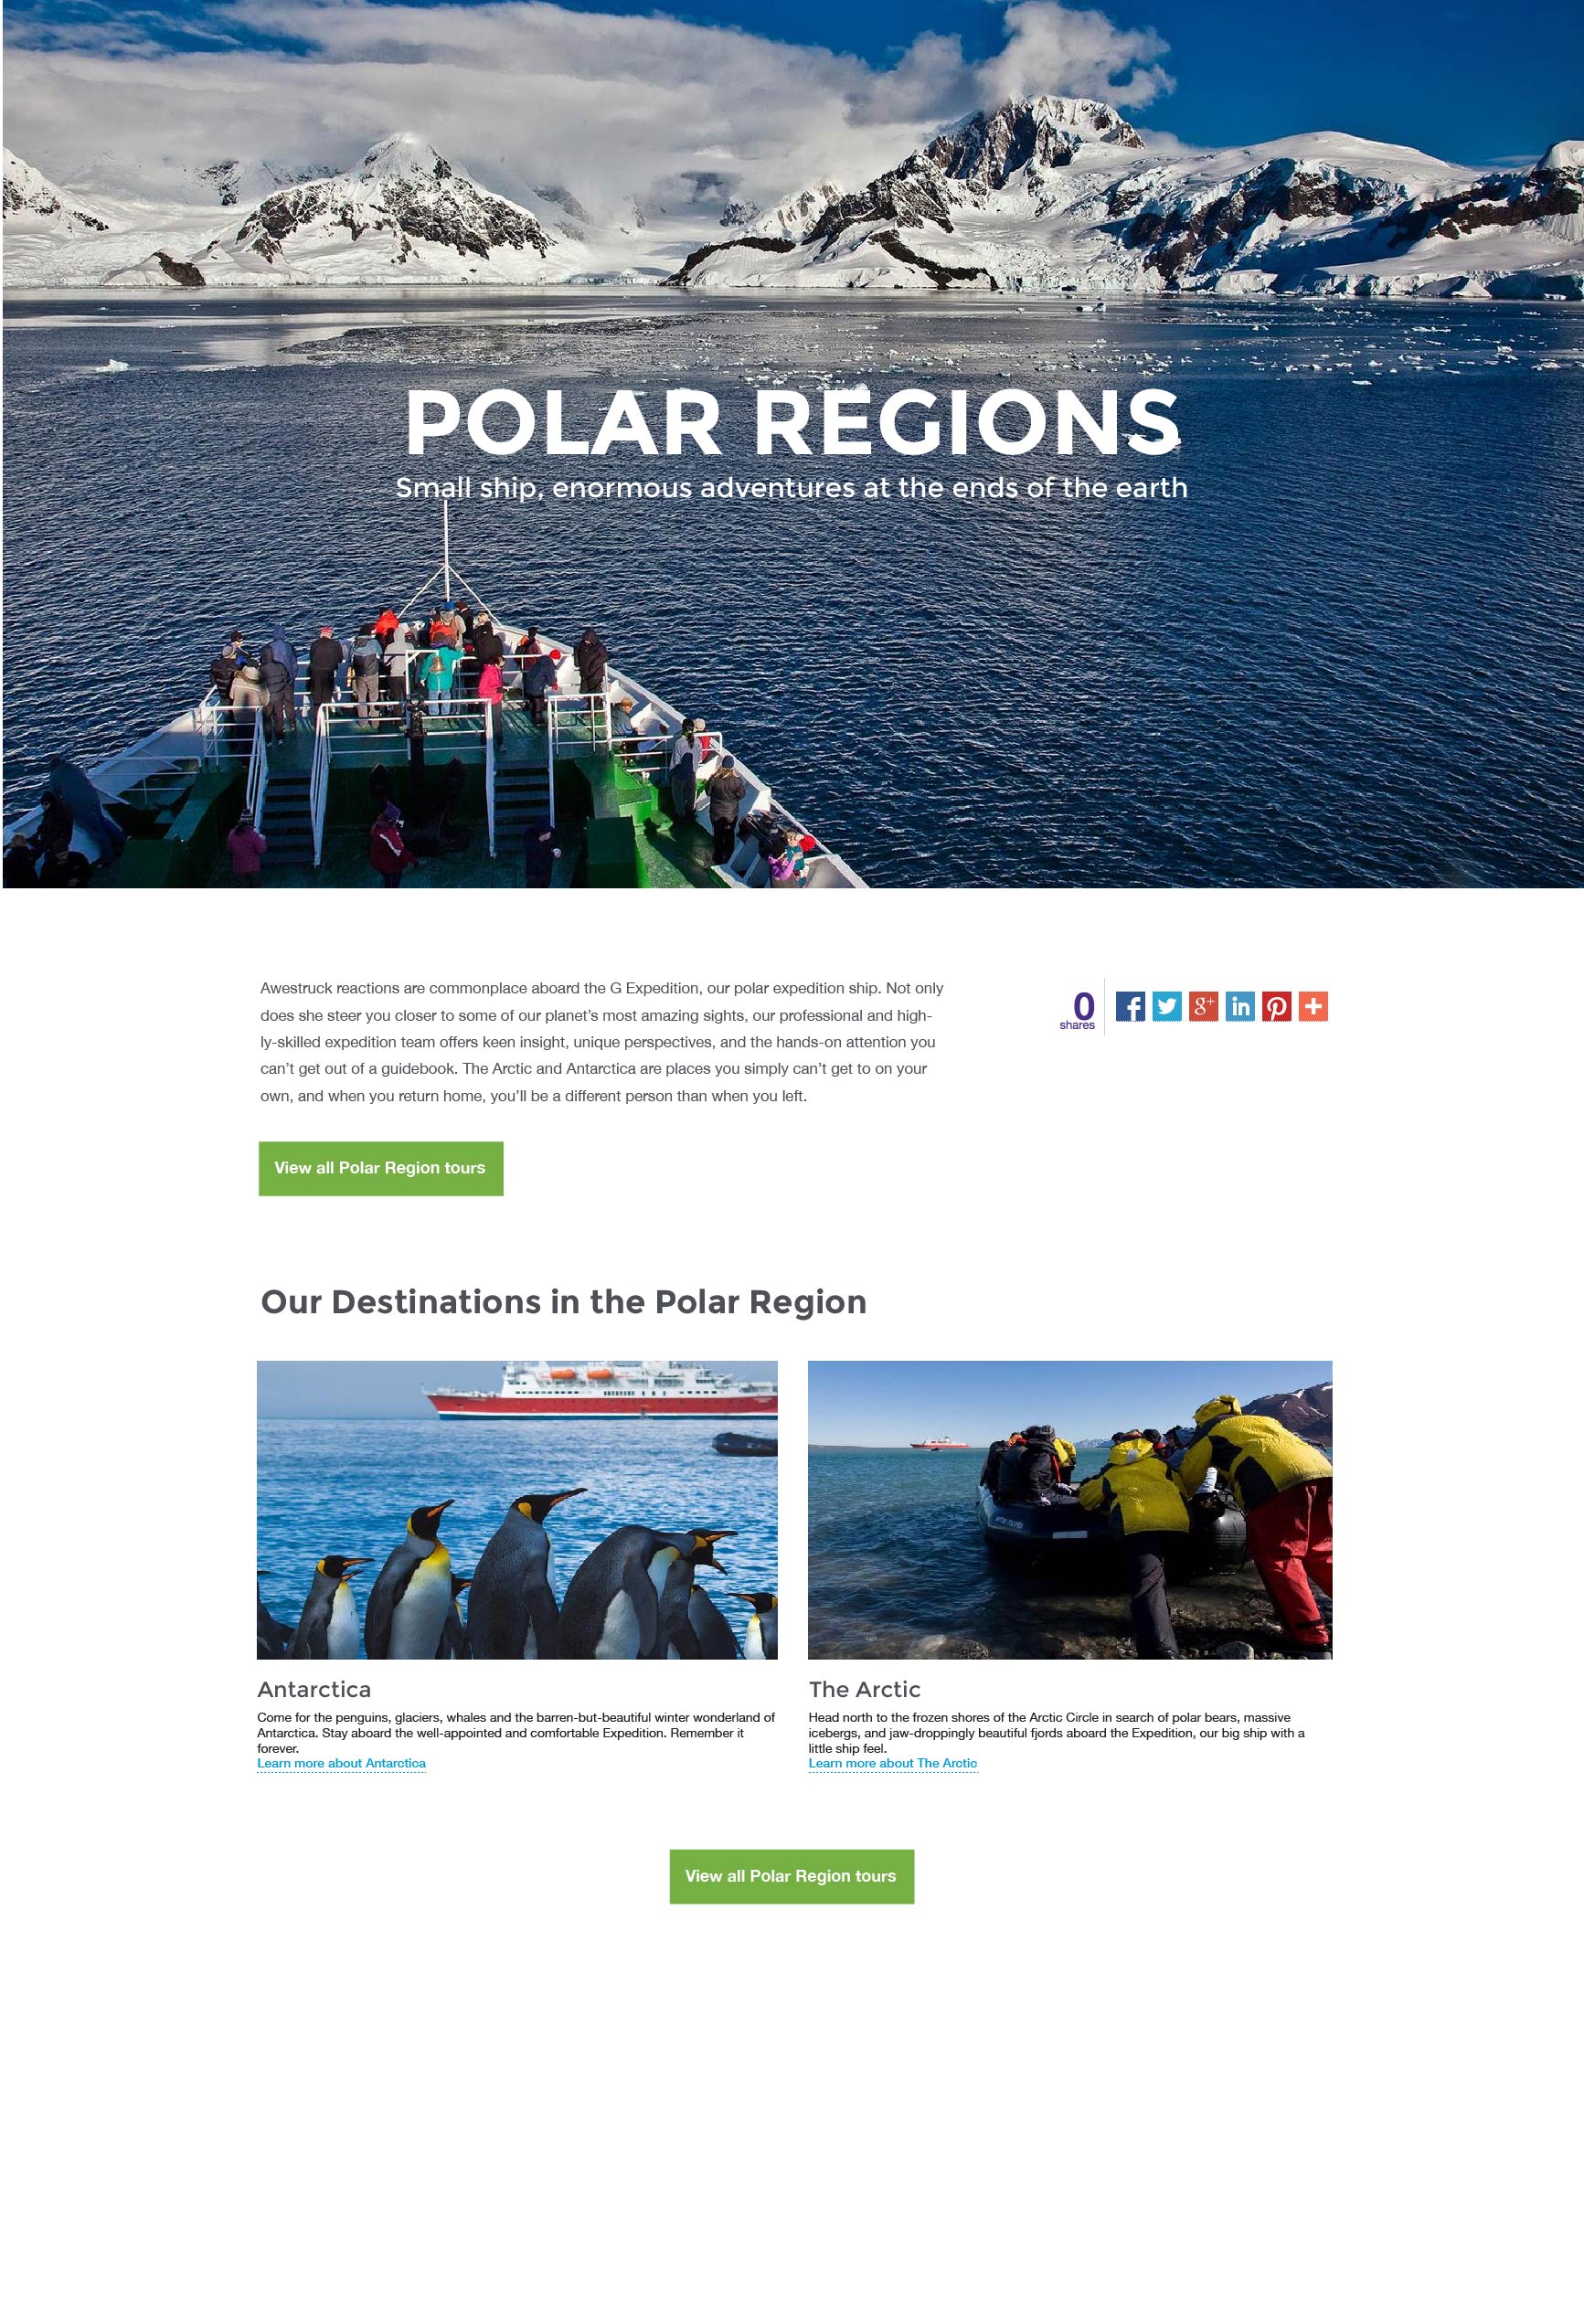
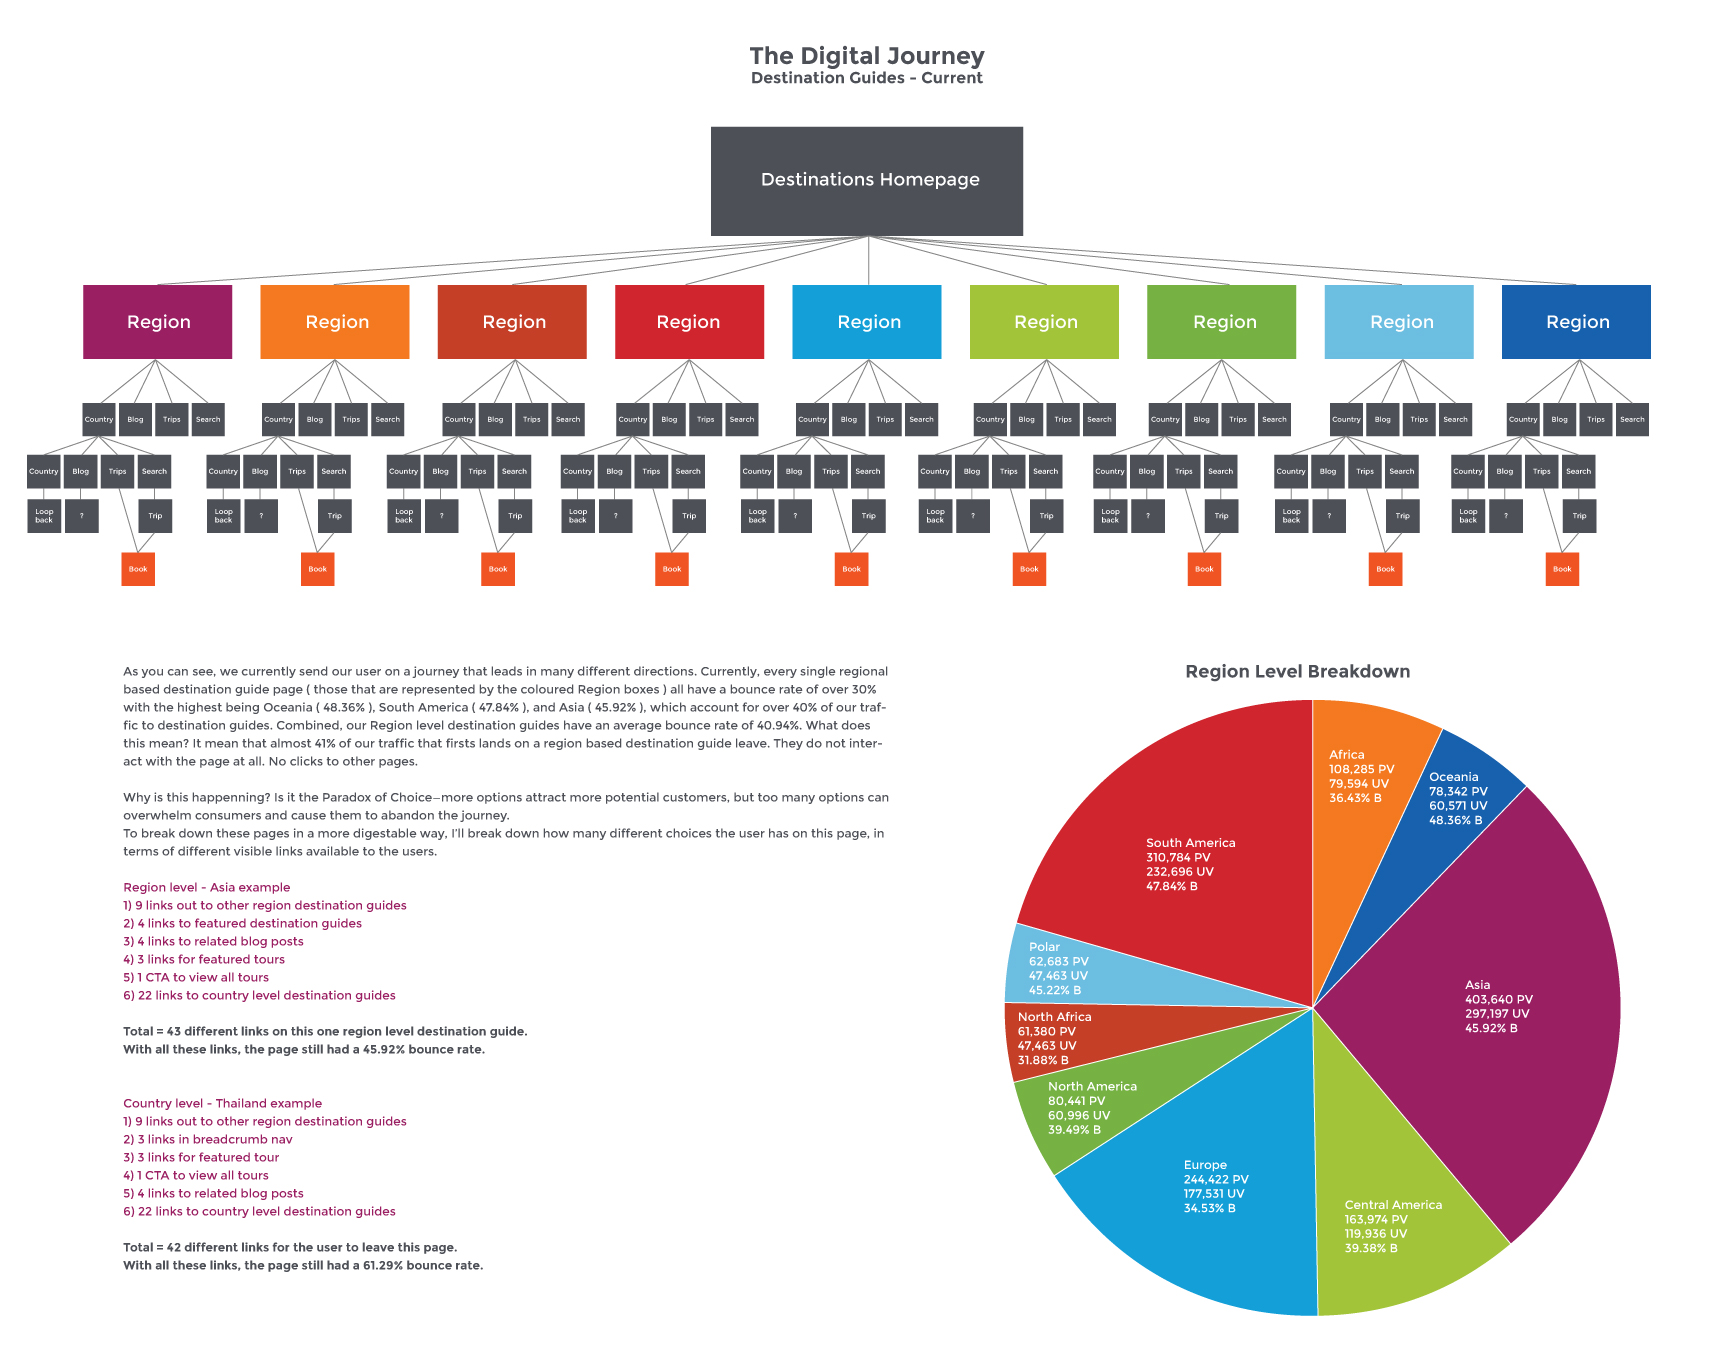
We were sending our users on a journey that leads in many different directions. Every single regional based destination guide page all have a bounce rate of over 30% with the highest being Oceania ( 48.36% ), South America ( 47.84% ), and Asia ( 45.92% ), which account for over 40% of our traffic to destination guides. Combined, our Region level destination guides have an average bounce rate of 40.94%. What does this mean? It mean that almost 41% of our traffic that firsts lands on a region based destination guide leave. They do not interact with the page at all. No clicks to other pages.
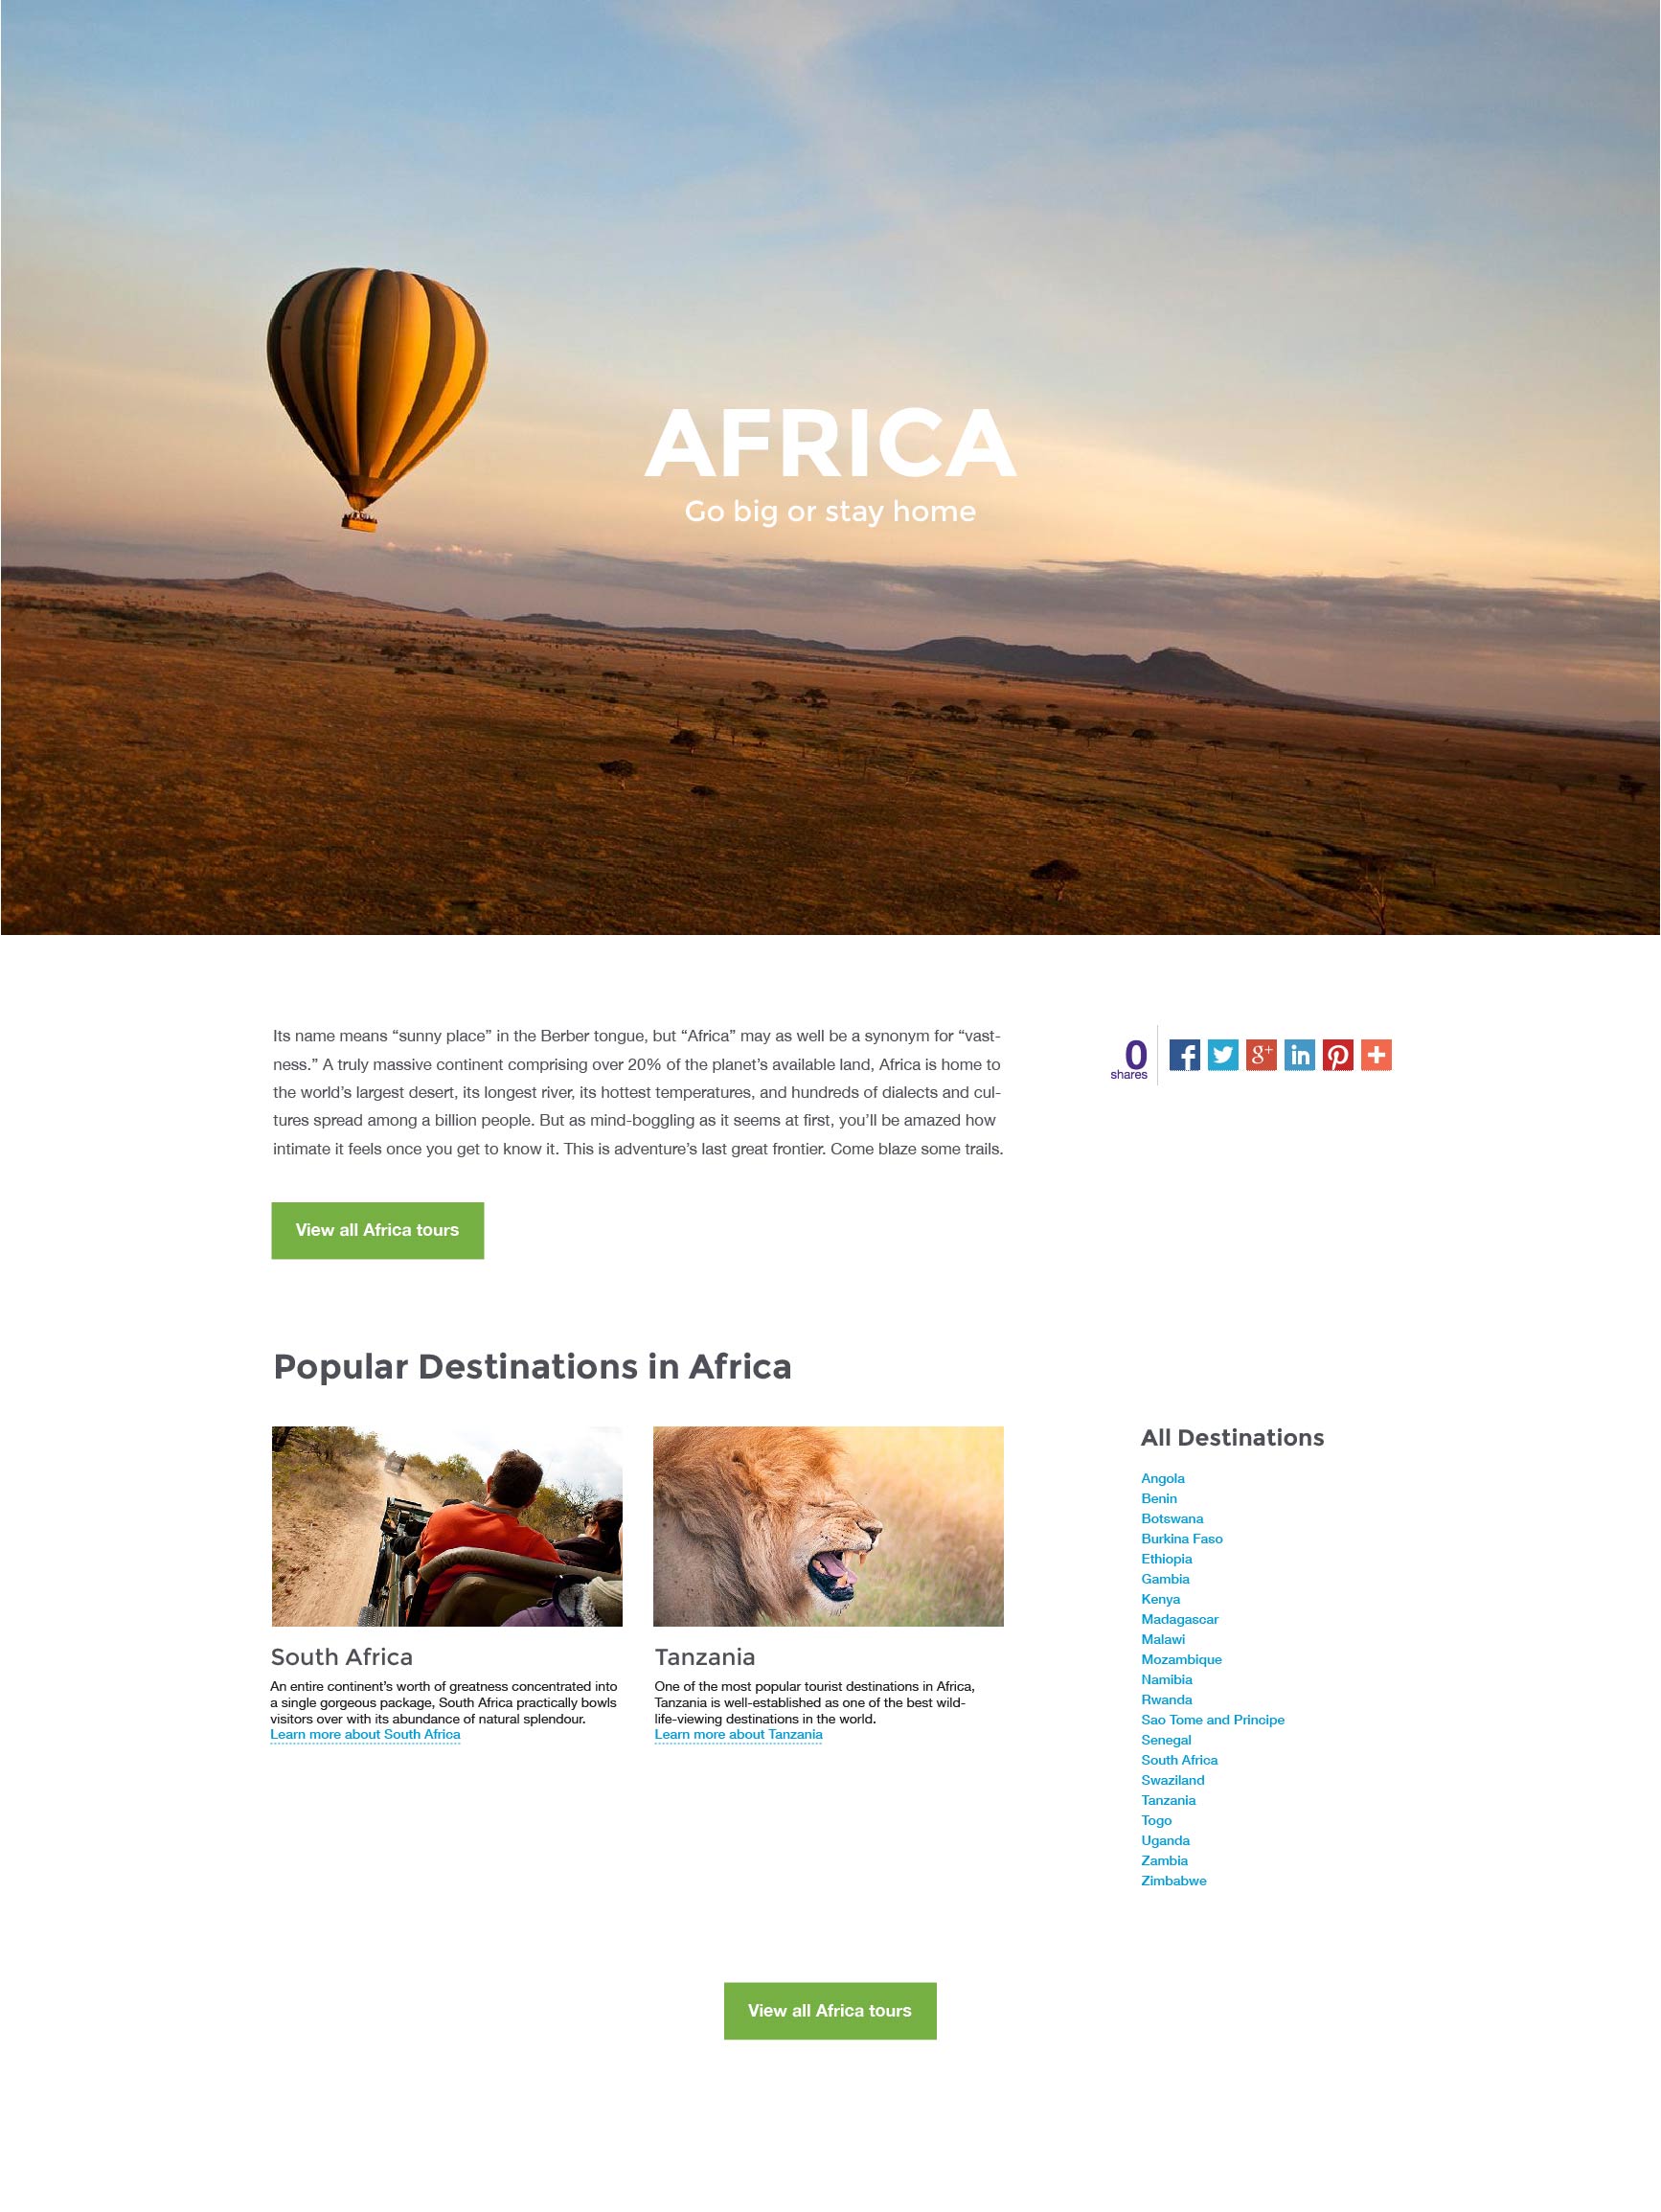
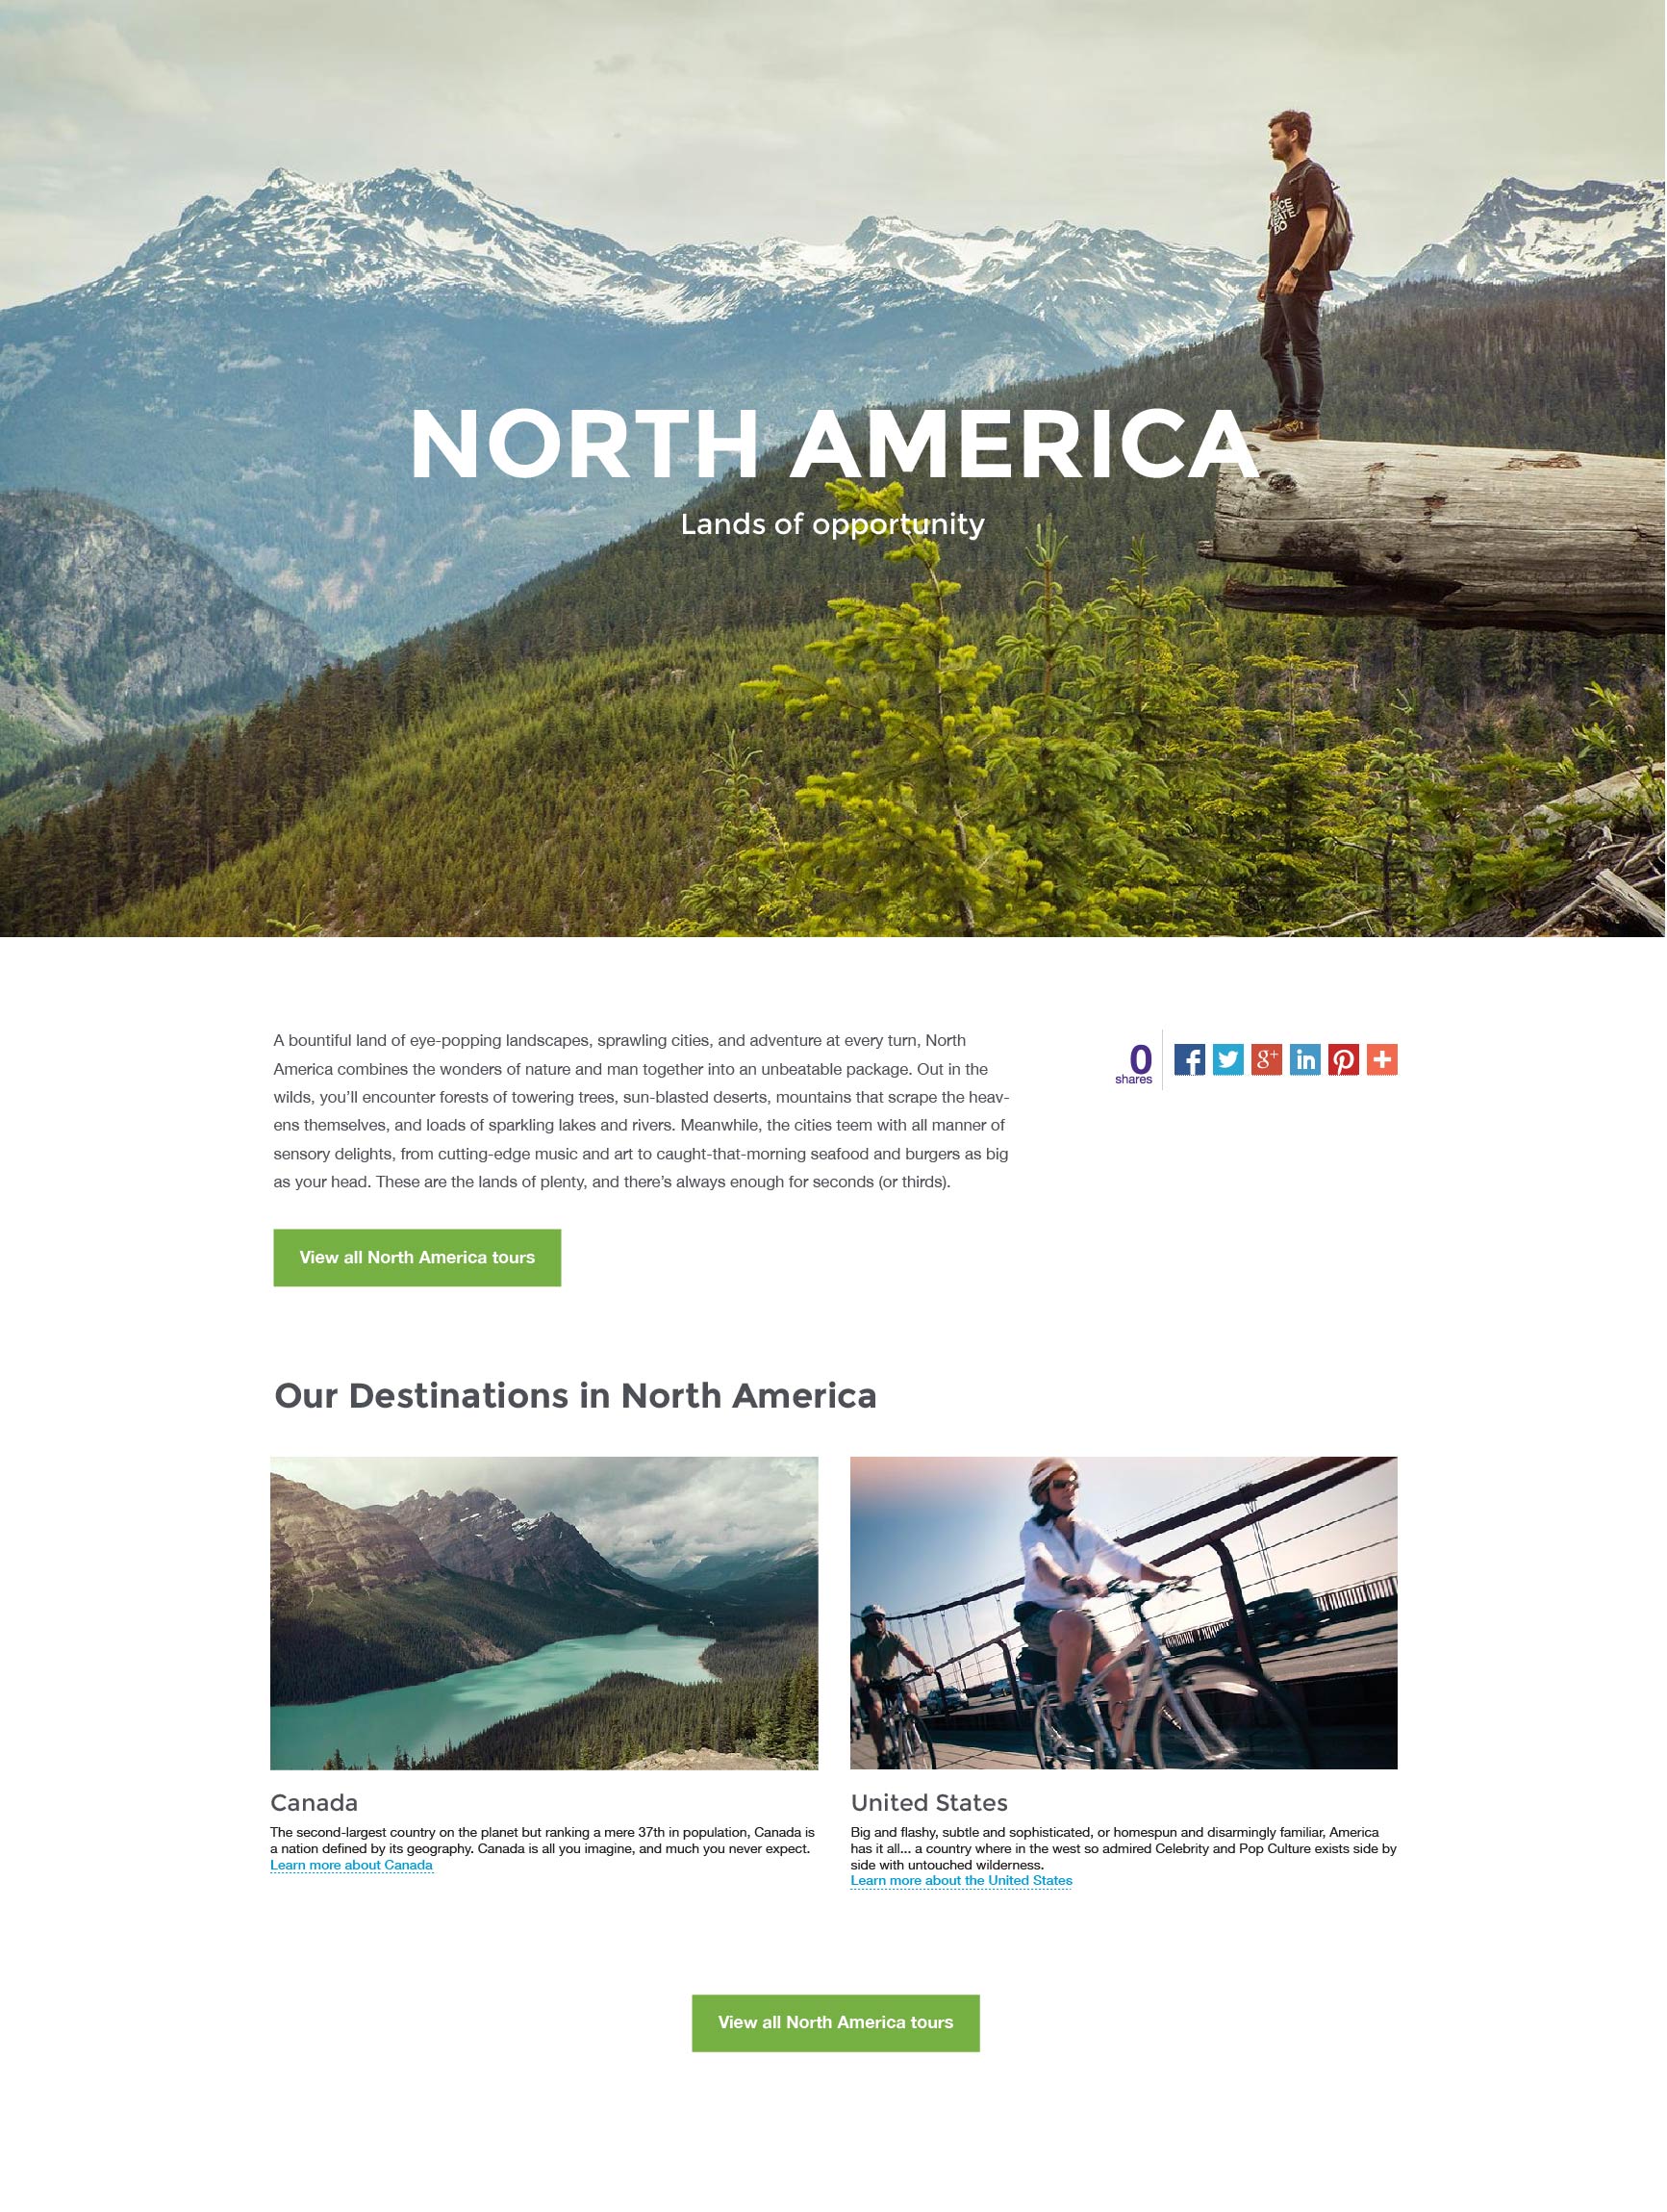
One page was re-designed with a more linear user-flow, and tested against the old design.
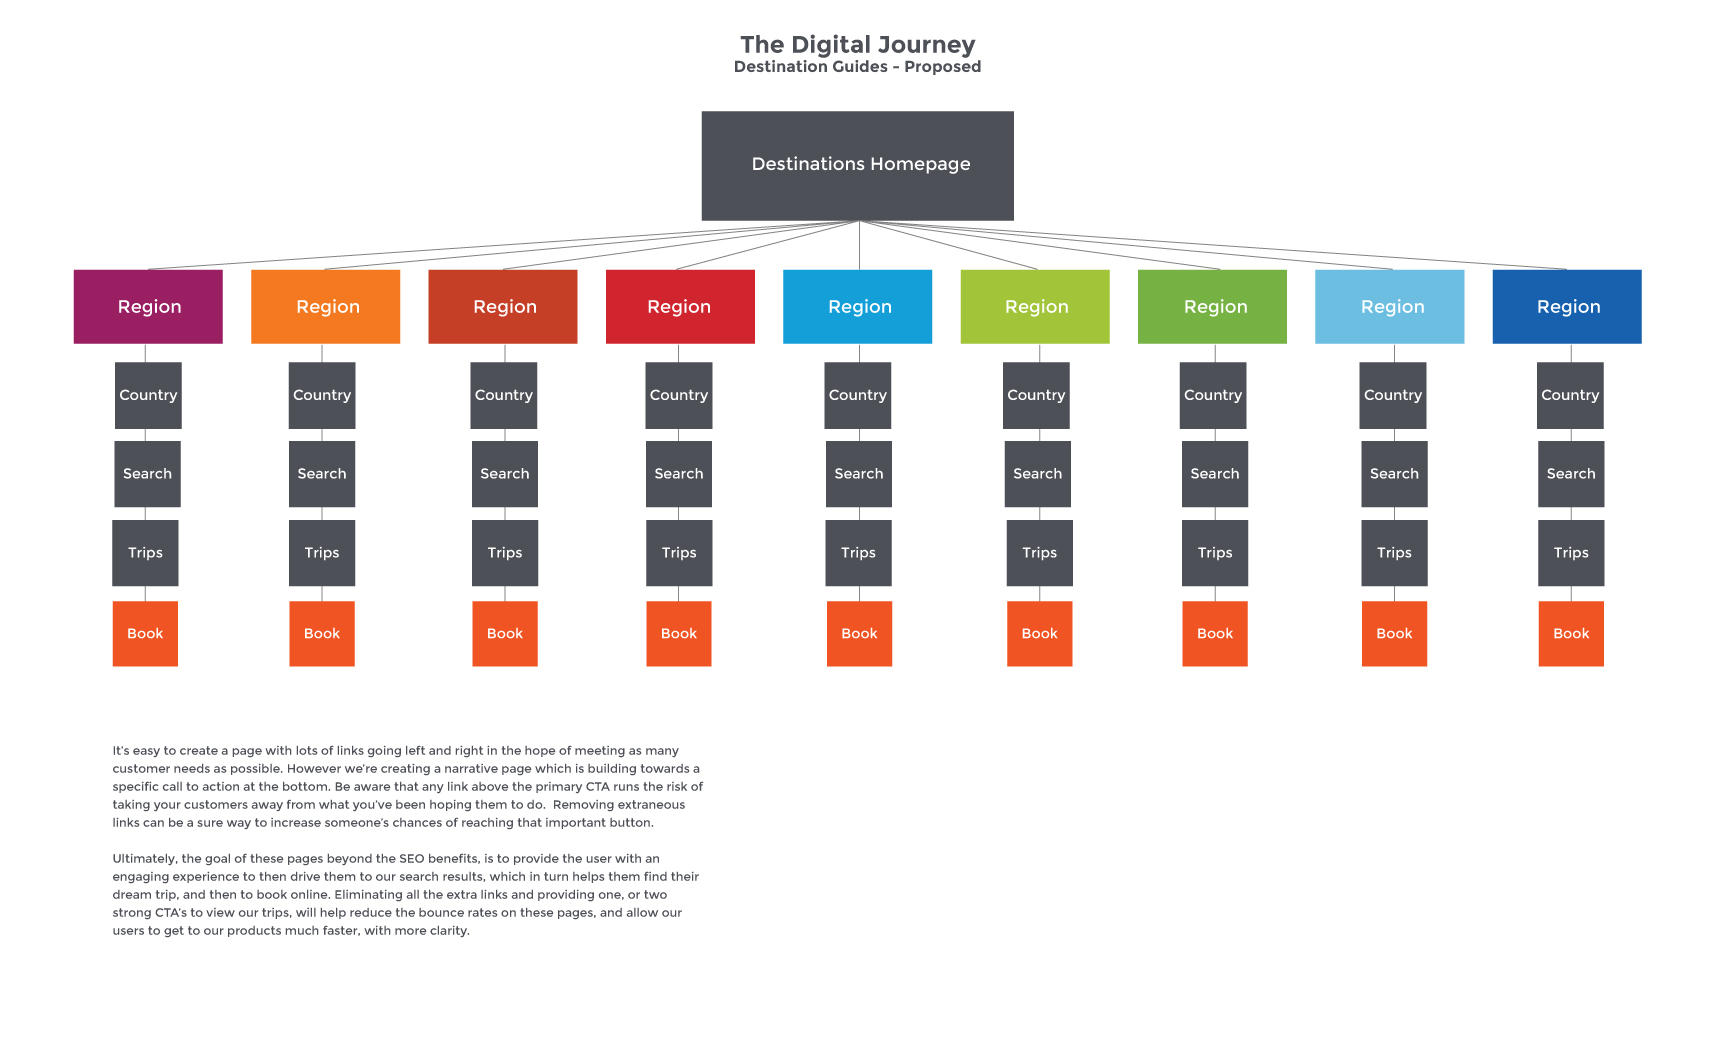
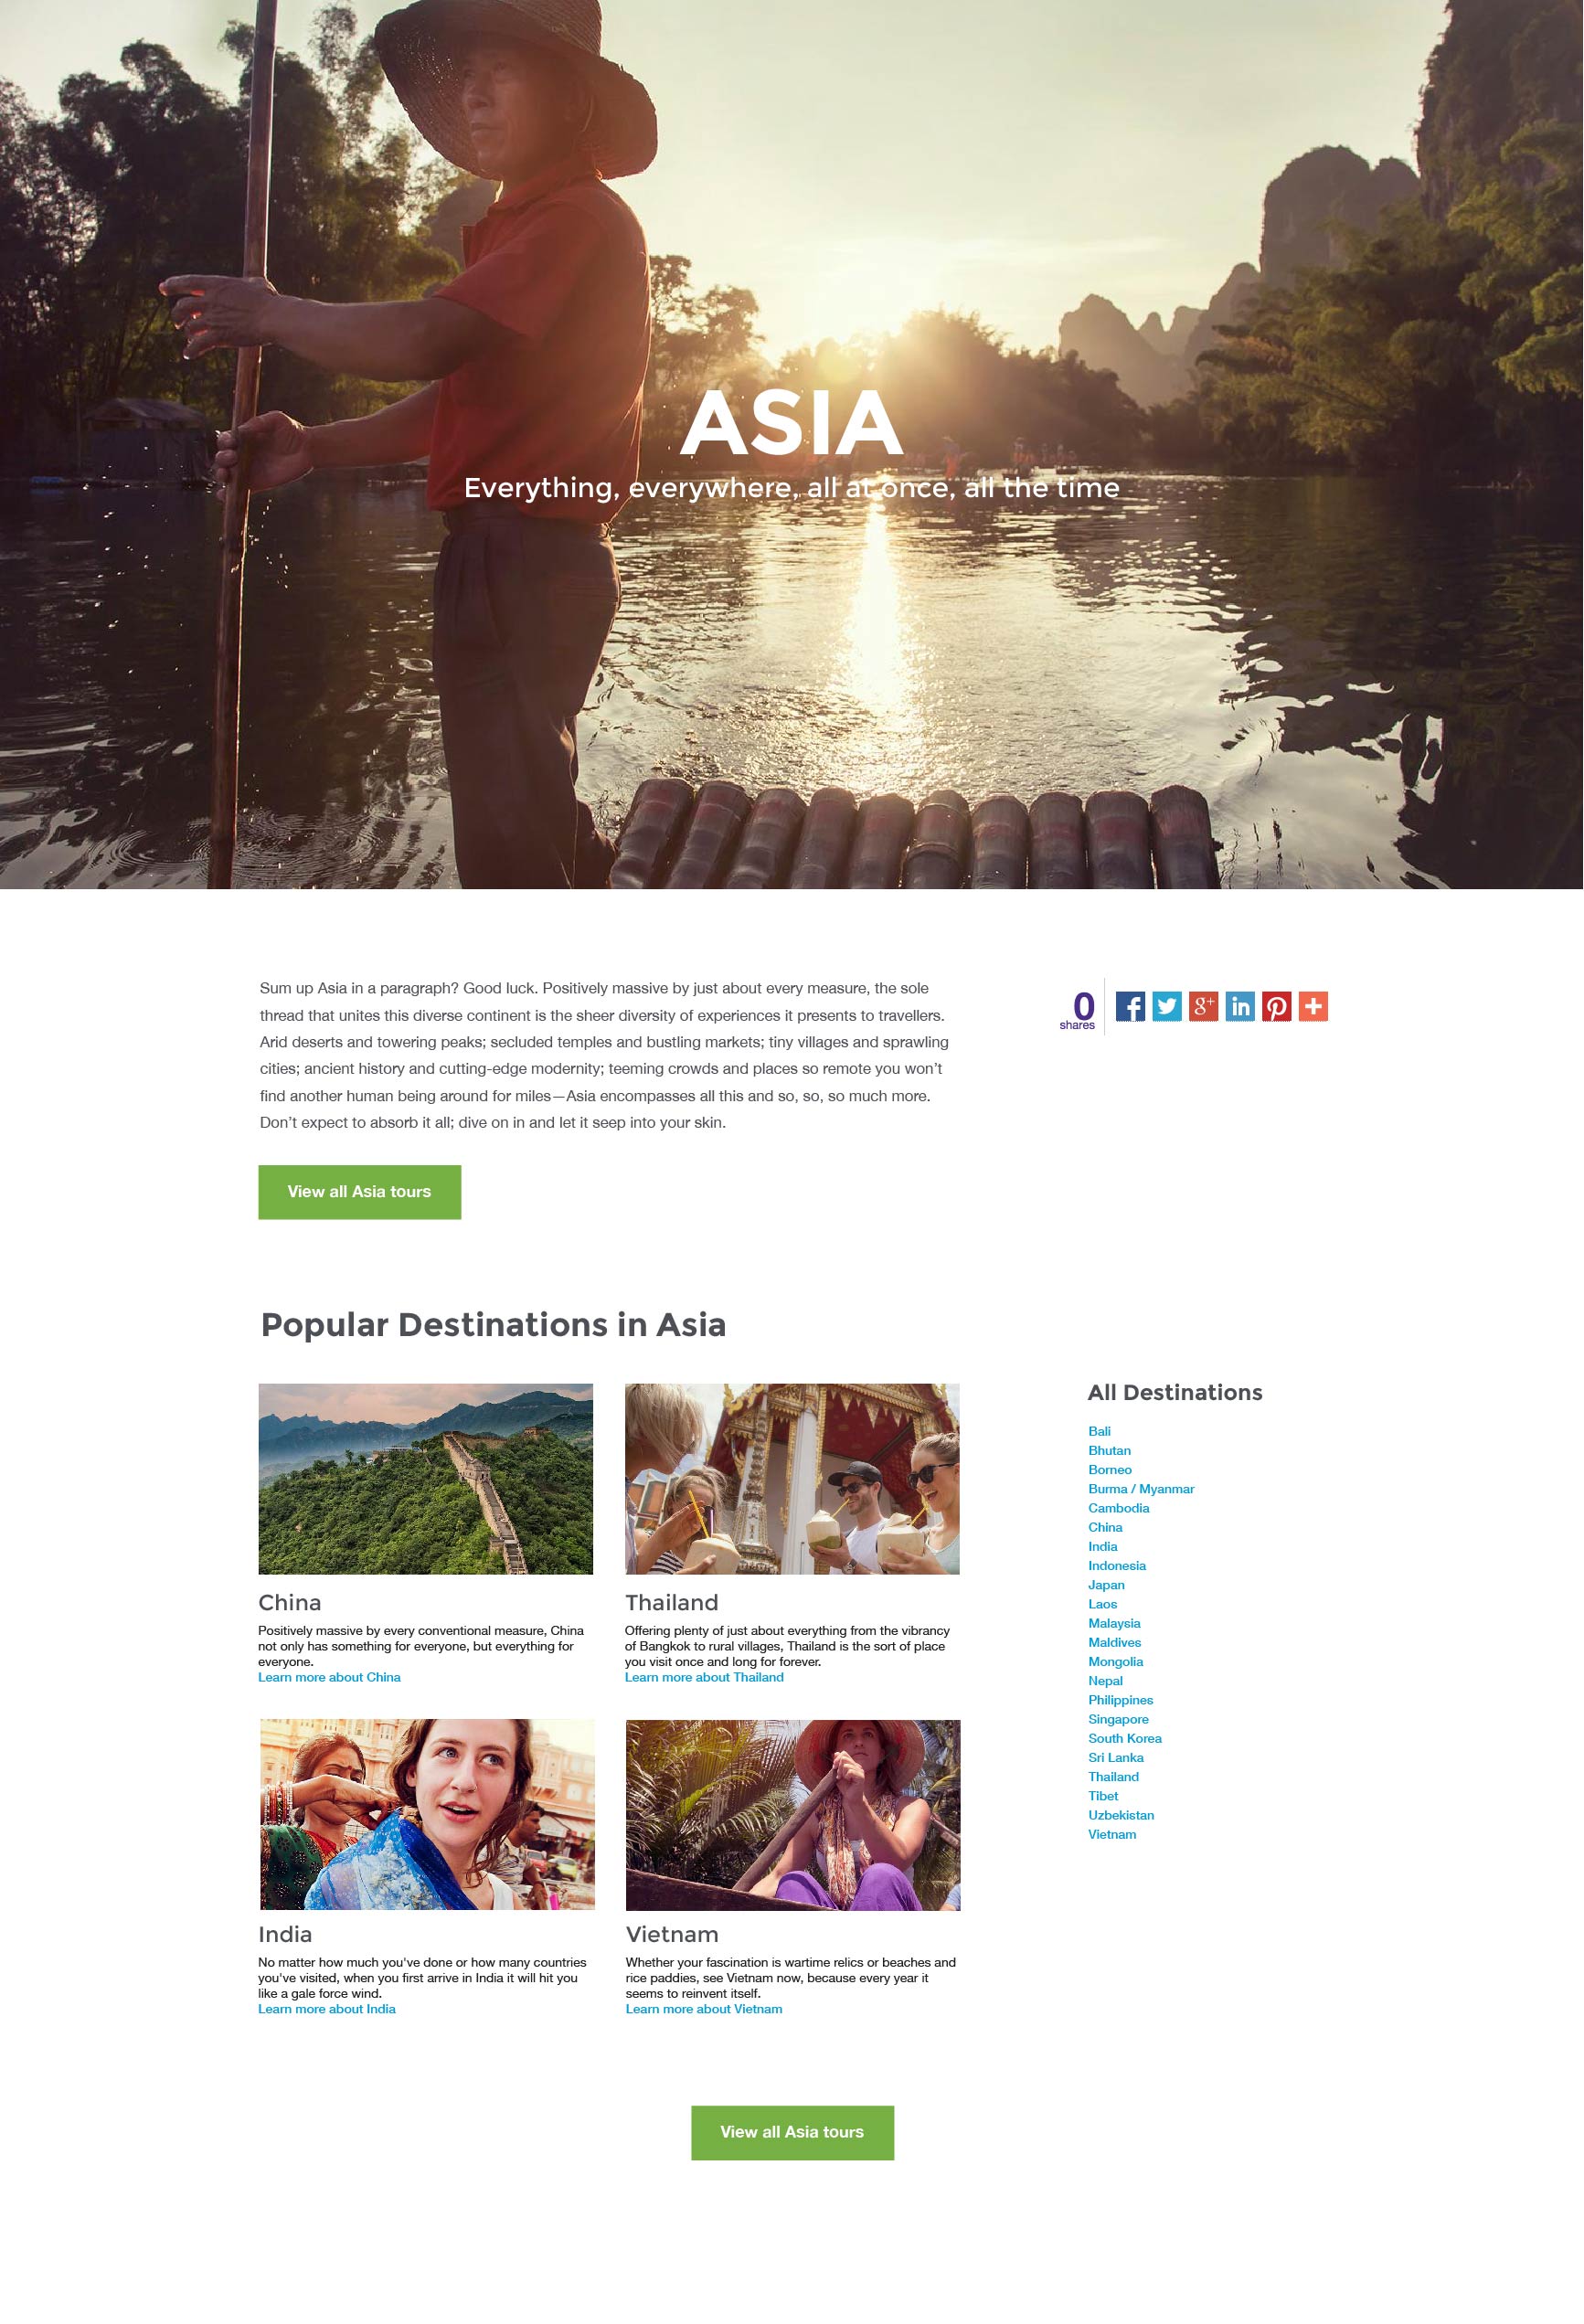
The A/B test showed that the new page performed better.
- Bounce rate dropped by 33%
- Exit rate dropped by 18%
- Page value increased by $2.40 (a 3% increase)
So what does a 3% increase actually mean?
Take the same number of uniques and subtracts the same exit rate and multiple the different page values, and gets the difference from Mar 25-Apr 25 for both 2015 and 2016.
179,625(uniques)-6.84%(exits)= 167,338.65 (true uniques)
167338.65 x 11.61(this years page value) = 1,942,801.7265
167338.65 x 11.24 (last years page value) = 1,880,886.426
1942801.7265 – 1880886.426 = $61,915.30
( revenue increase since launch of destination guides )
$61915.30 x 12 (months) = $742,983.606
( theoretical increase in revenue over the year if maintained )
